1067 unique view(s)
Updates by Tech Trader, a fully autonomous trading system with no human intervention.
Receive updates via Twitter @TechTraderAI or StockTwits @TechTraderAI.
Charts and analysis also available for: Stocks, Cryptocurrencies
Receive updates via Twitter @TechTraderAI or StockTwits @TechTraderAI.
Charts and analysis also available for: Stocks, Cryptocurrencies
pftq (Official) says on The Tech Trader Wall...
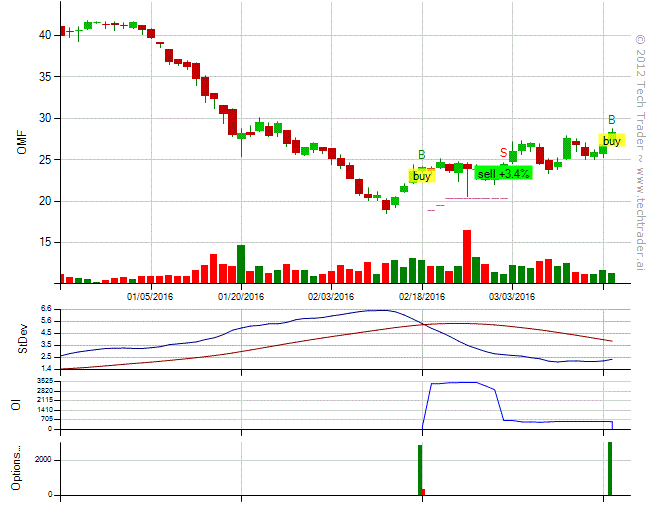
Tech Trader back into $OMF on the same April call buying, this time at $31 strike. Seems like someone is really betting on it going above $30 by next month. Funny stock to watch because it always has 10% up days after it pulls back.
OMF 4/15/2016 31x Calls, 5000@$1.0499
MV: $0.5M | $Not.: $5.0M | OI: 0 | 19.9% TotalOI
24.3% StockVolume | 46.6% OptionVolume
OMF 4/15/2016 31x Calls, 5000@$1.0499
MV: $0.5M | $Not.: $5.0M | OI: 0 | 19.9% TotalOI
24.3% StockVolume | 46.6% OptionVolume

1073 unique view(s)
March 17th, 2016
pftq (Official) says on The Tech Trader Wall...
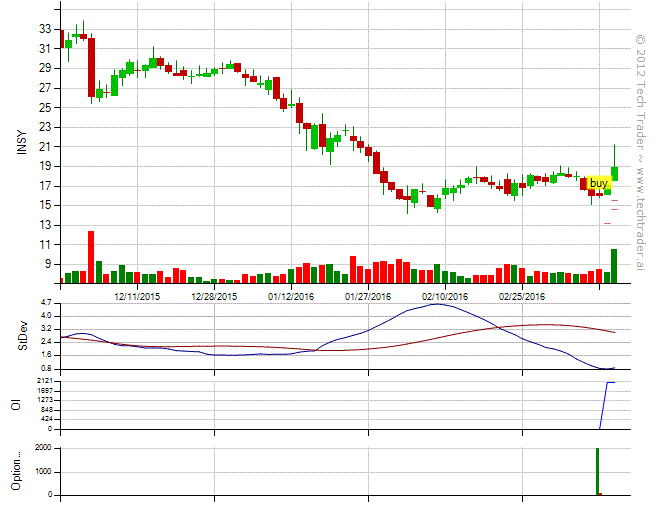
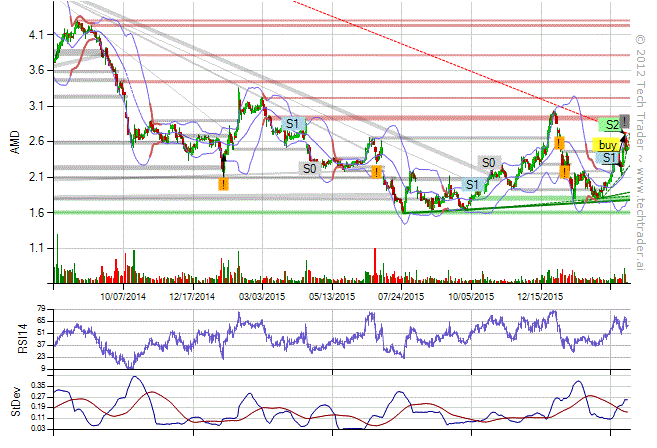
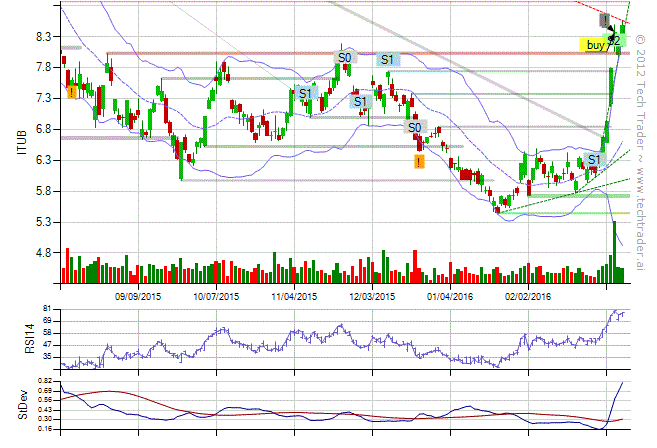
Brazil theme finally playing out in size after Fed, with names like PBR, ITUB, and EWZ up 8-10% a piece today. AMD also up 5% on talks about Intel licensing their GPU patents. Last theme to watch would be the marijuana one with INSY, which is presenting at a conference tomorrow.
1037 unique view(s)
March 16th, 2016
pftq (Official) says on The Tech Trader Wall...
Been a rather uneventful couple of months, but it looks like Tech Trader is finally building a couple themes here, first with Brazil (note that it cut ITUB and RIO though), then marijuana (INSY), and now potentially virtual reality with AMD. These are longer medium term plays, so we'll see how these play out.

1035 unique view(s)
March 14th, 2016
pftq (Official) says on The Tech Trader Wall...
1108 unique view(s)
March 11th, 2016
pftq (Official) says on The Tech Trader Wall...
1117 unique view(s)
March 10th, 2016
pftq (Official) says on The Tech Trader Wall...
Much of the market flat today after all the whipsaw, but IHUB and PBR from a couple days ago are up about 5% a piece. Not really sure why, but interesting to watch.
1229 unique view(s)
March 8th, 2016
pftq (Official) says on The Tech Trader Wall...
Starting to finally see some shakiness in the market. The XLU long and SMH short call from last week is starting to play out pretty well now.
Some other interesting observations are that Brazillian names in particular are being picked up on the long side. Tech Trader overall is still net short though.
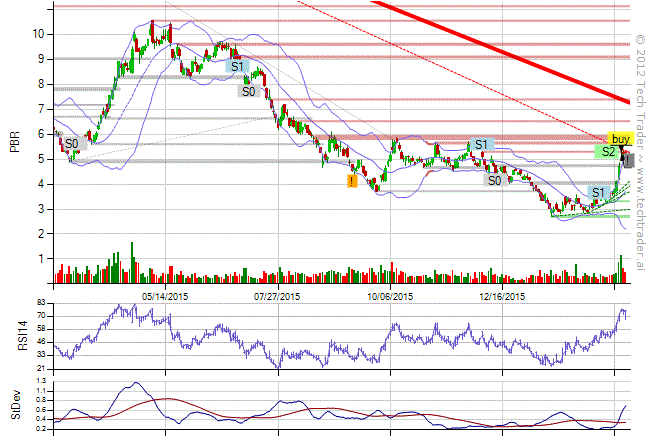
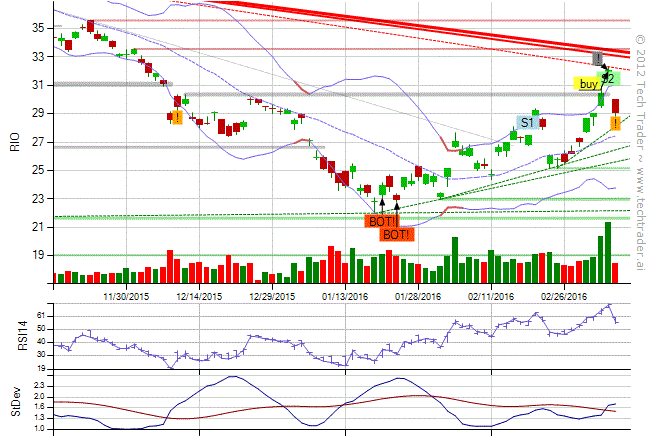
Some other interesting observations are that Brazillian names in particular are being picked up on the long side. Tech Trader overall is still net short though.


1399 unique view(s)
March 5th, 2016
dipsea (Guest) says on The Tech Trader Wall...
Excellent data worth considering. Thanks
1398 unique view(s)
March 4th, 2016
pftq (Official) says on The Tech Trader Wall...
XLU up over a percent since the bottom call a couple days ago, which is just weird since it's the opposite of what you'd expect with how rates are moving on the stronger than expected job numbers, but we'll take what we can get.
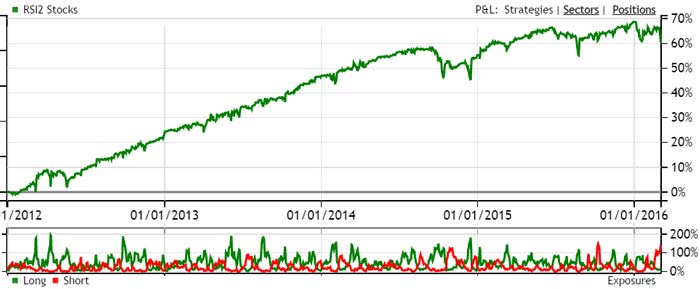
Tech Trader still net short (50% cash, 20% long, 50% short) but pretty much holding flat in performance despite the market rally. It's basically choosing to sidestep the rally out of caution. Some older strategies that are not traded live but we still monitor are also flagging extremely bearish, namely our RSI2 stocks which very rarely is over 100% short is currently 130% short and continuing to add. Main takeaway is the market is coming off very overbought and risk is high to the downside.
Below is the current exposure of the older RSI2 stocks strategy; it's not traded live for the obvious volatility in performance, but the peak exposure periods have a hitrate of 90% with those periods only happening a couple times a year.

buck.andrews (Guest) says on The Tech Trader Wall...
Thanks for the explanation. This helps me to better understand tech trader.
1392 unique view(s)
March 2nd, 2016
pftq (Official) says on The Tech Trader Wall...
CS and OMF up about 2-3% each. Not sure why; we're watching closely just to see what happens, as often times these can be frontrunning some kind of news.
Tech Trader overall getting net short again though both by shorting more and getting out of existing long positions. It is also getting more defensive with what it has left over in long names. SMH just got shorted and XLU is being bought on intraday bottom, both of which are defensive signs.
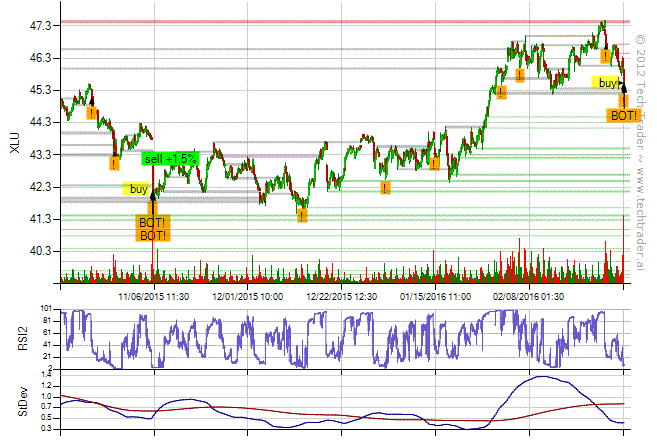
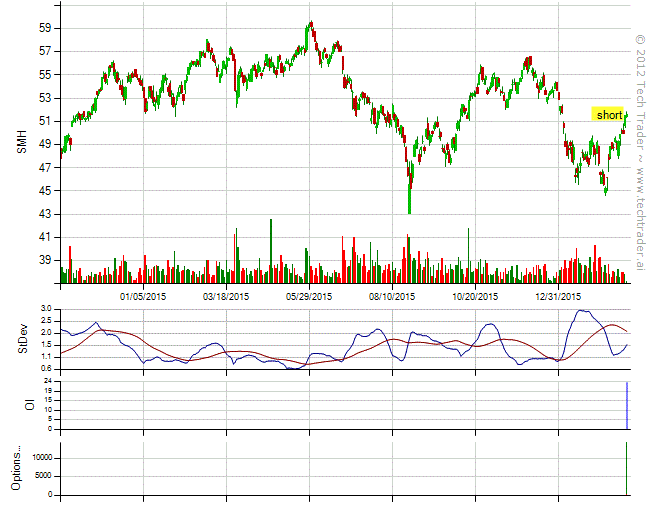
Tech Trader overall getting net short again though both by shorting more and getting out of existing long positions. It is also getting more defensive with what it has left over in long names. SMH just got shorted and XLU is being bought on intraday bottom, both of which are defensive signs.


1399 unique view(s)
March 1st, 2016
pftq (Official) says on The Tech Trader Wall...
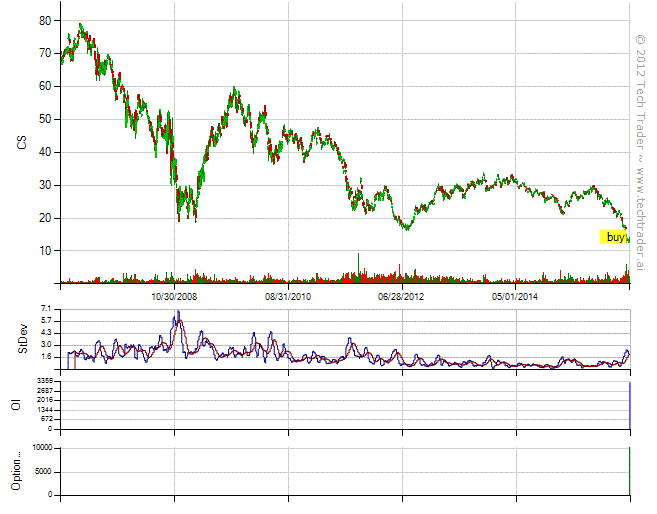
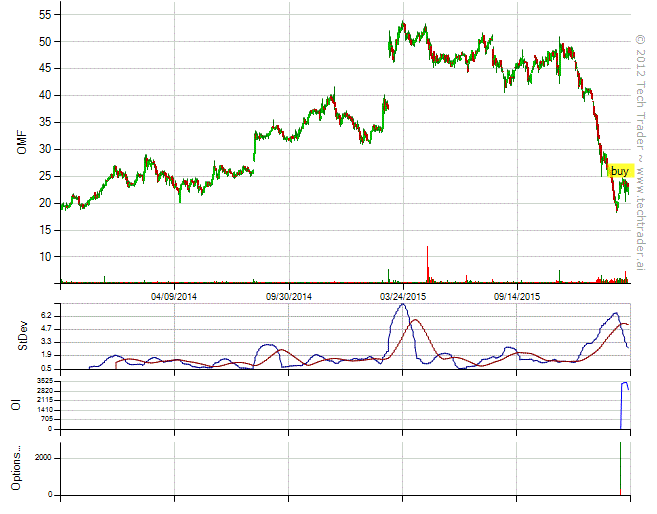
Some really interesting activity happening in the finance sector just now. Someone coming into CS (Credit Suisse) with heavy call buying at what appears to be recession lows. OMF, a name with call buying earlier last month, also just started spiking up (literally going straight up on the 1 min chart).


1419 unique view(s)
February 26th, 2016
pftq (Official) says on The Tech Trader Wall...
1443 unique view(s)
February 25th, 2016
pftq (Official) says on The Tech Trader Wall...
1449 unique view(s)
February 24th, 2016
pftq (Official) says on The Tech Trader Wall...
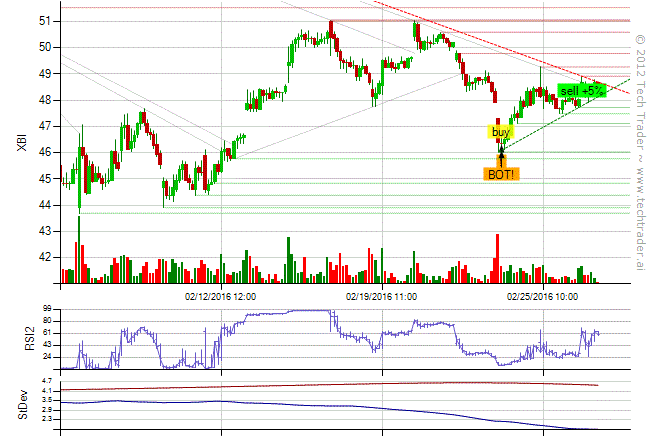
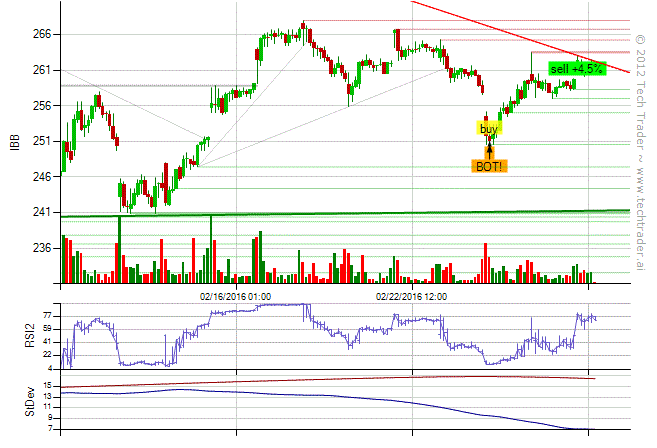
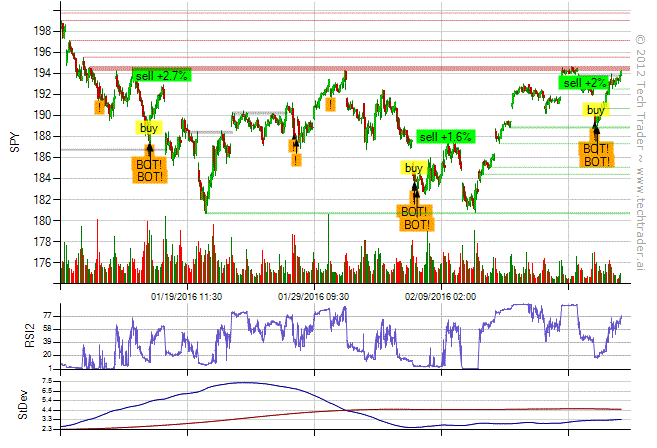
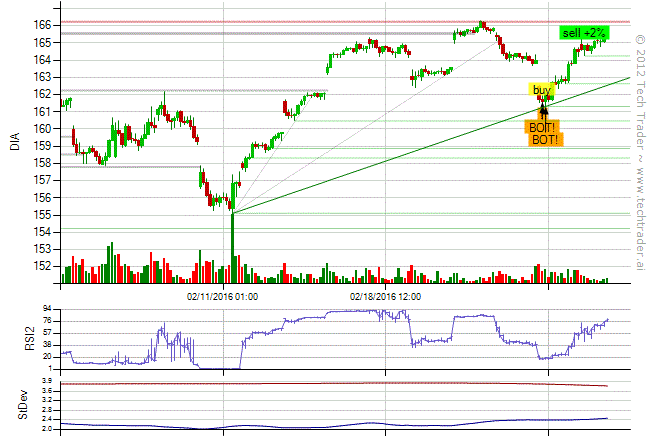
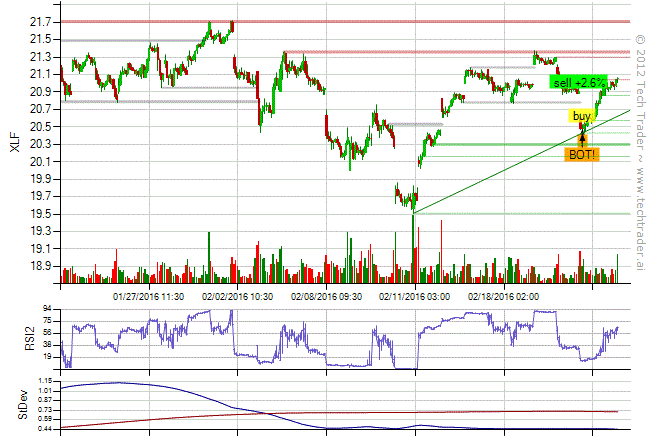
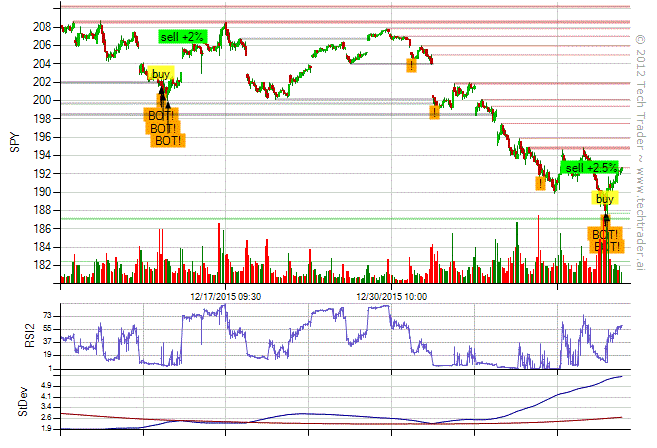
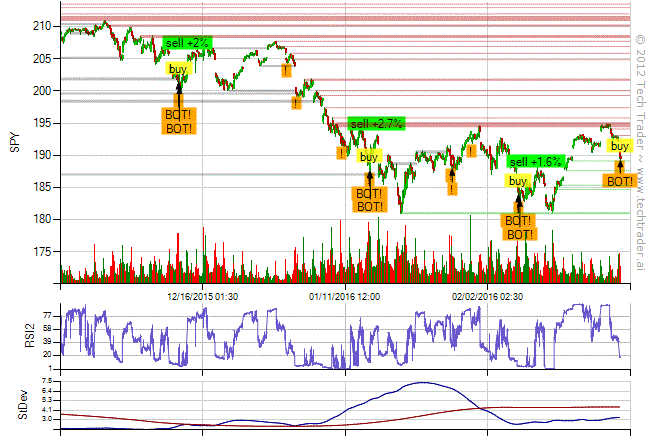
Tech Trader coming back to life with intraday bottom signals on SPY, DIA, XLF, IBB, XBI just now after being about 60% cash and 10-20% net short for the last couple weeks on individual stocks. Again intraday bottom signals are just first responders, so we could still keep going down, just that we're close enough to start scaling in. The big one would be the once-in-a-blue-moon RSI2 SPY daily signal as usual.
SPY intraday bottom at $189.66.
SPY intraday bottom at $189.66.

pftq (Official) says on The Tech Trader Wall...
Tech Trader out of SPY at $193.33 for 2% in less than a day. Market moves so extreme that Tech Trader is again scaling out in the same day. Other ETFs still being held for now.
pftq (Official) says on The Tech Trader Wall...
All ETFs up over a percent since the bottom call. XBI and IBB up 3-4%.
zonayev (Guest) says on The Tech Trader Wall...
Nice job!
twgarry (Guest) says on The Tech Trader Wall...
Yes agreed very impressive!
1415 unique view(s)
February 12th, 2016
pftq (Official) says on The Tech Trader Wall...
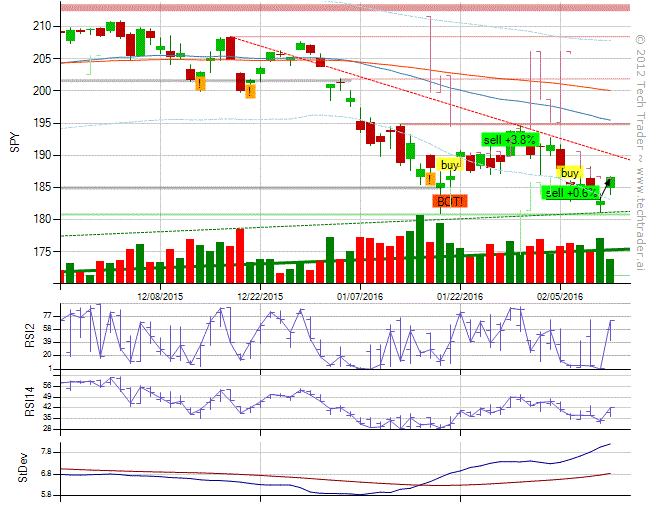
Tech Trader out of its SPY RSI2 buy from $185.20 to $186.60 for 0.6%. Speaks to the environment that Tech Trader is not willing to hold longer. On the next sharp move up or down, Tech Trader will continue range trading SPY. Should be fun.
Without SPY, Tech Trader is actually now 25% net short (21% long by 46% short). We haven't seen Tech Trader this net short since 2011 of the debt ceiling crisis. The biggest sector exposures are 11% short technology, followed by 7% short utilities. However, keep in mind that it is not actually short the index, just select names, and that it is still almost 60% in cash.
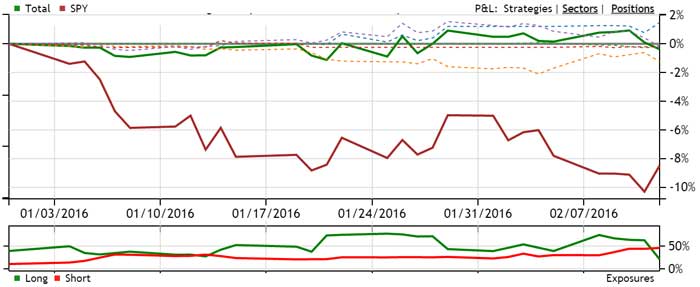
Tech Trader's overall portfolio still performing flat for the year, with S&P now down 8.5%.
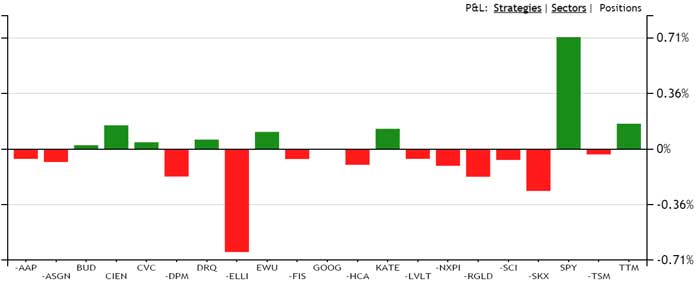
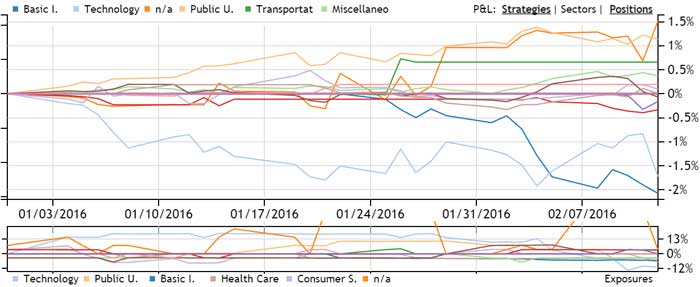
Without SPY, Tech Trader is actually now 25% net short (21% long by 46% short). We haven't seen Tech Trader this net short since 2011 of the debt ceiling crisis. The biggest sector exposures are 11% short technology, followed by 7% short utilities. However, keep in mind that it is not actually short the index, just select names, and that it is still almost 60% in cash.

Tech Trader's overall portfolio still performing flat for the year, with S&P now down 8.5%.


scott.burrill (Guest) says on The Tech Trader Wall...
Excellent and thanks for the update.
Great weekend
Great weekend
twgarry (Guest) says on The Tech Trader Wall...
Yes well done!!
1351 unique view(s)
February 10th, 2016
pftq (Official) says on The Tech Trader Wall...
SPY up almost a percent now in premarket. Took an extra day but the once-in-a-blue-moon SPY signal playing out yet again. It's funny how these trades always line up before some major event like the Fed. Target price moving down slightly to $188 now from $190, which is still a sizable gain from its $185.20 entry on Monday.
1350 unique view(s)
February 8th, 2016
pftq (Official) says on The Tech Trader Wall...
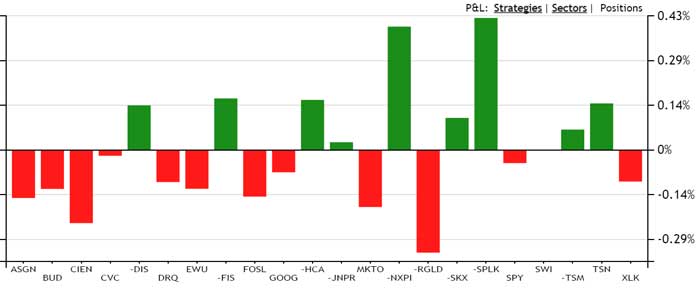
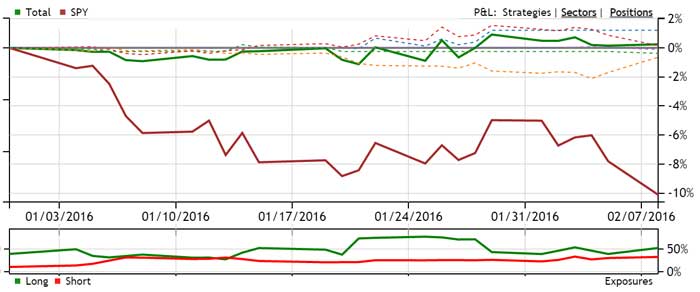
Tech Trader remaining slightly up for the day even with the market down 2.5% now. For the year, SPY is now down 10% while Tech Trader is up marginally but with virtually no drawdown. The timing of Tech Trader going into 60% cash at the beginning of February was pretty much spot on, as it was at the end of December. Now we are awaiting for Tech Trader's once-in-a-blue-moon SPY bottom signals to kick in again (last ones in January and August).


pftq (Official) says on The Tech Trader Wall...
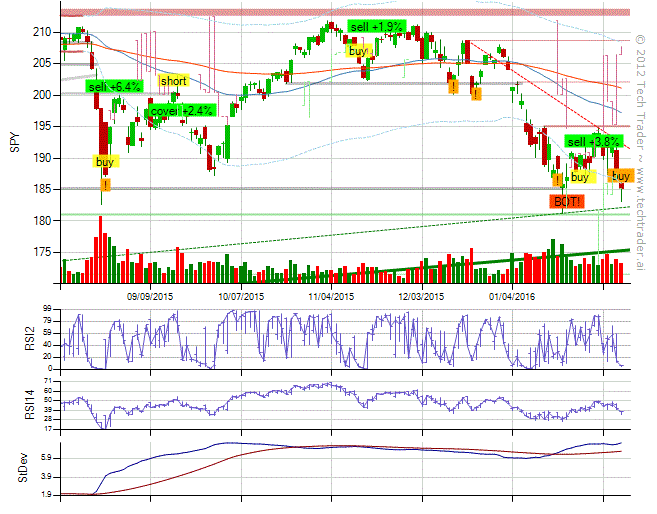
And there it is... The coveted once-in-a-blue-moon SPY bottom signal back yet again at $185.20 with an exit target of $190. It really speaks to the new environment we're in. Tech Trader is basically now expecting a choppy range-bound market with the January low being the floor and is trading according to that. The first bottom signal (labeled "BOT") in January was basically an initiation of sorts for Tech Trader to start looking for range-trading opportunities. The last time we got frequent back-to-back SPY signals like this was in 2011/2012 and then 2008 before that.

scott.burrill (Guest) says on The Tech Trader Wall...
Thank you
1321 unique view(s)
February 2nd, 2016
pftq (Official) says on The Tech Trader Wall...
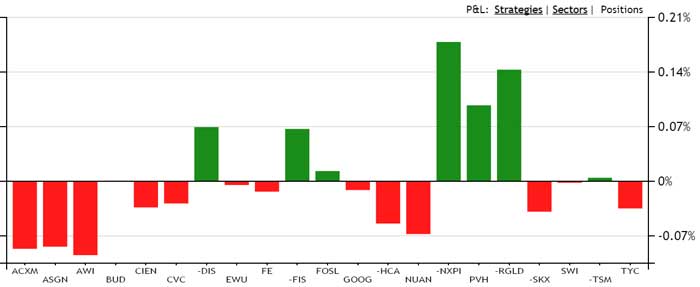
Tech Trader is back to its Dec/January playbook of being almost 60% cash and not moving at all during days of market sell off. Today SPY is down 1.6%. Tech Trader is actually slightly up despite being net long (46% long by 22% short). No real sector or thematic exposures. Nice to lock in a slight gain for the year so far though while SPY starts sinking back towards the lows.


1344 unique view(s)
January 29th, 2016
pftq (Official) says on The Tech Trader Wall...
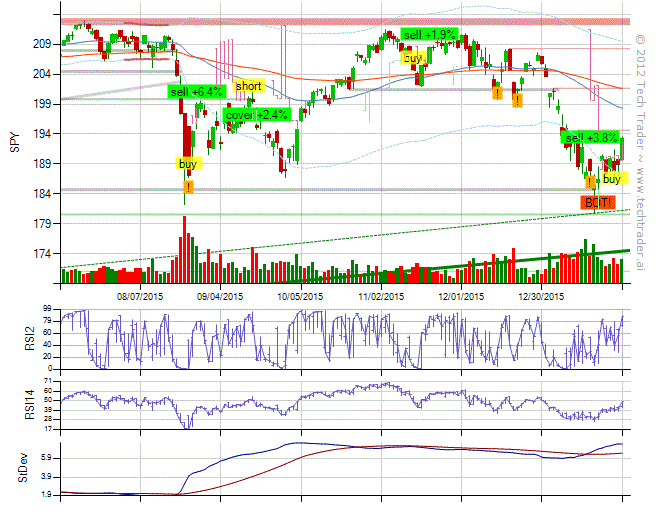
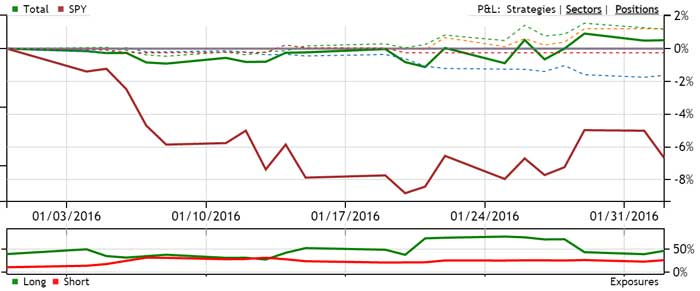
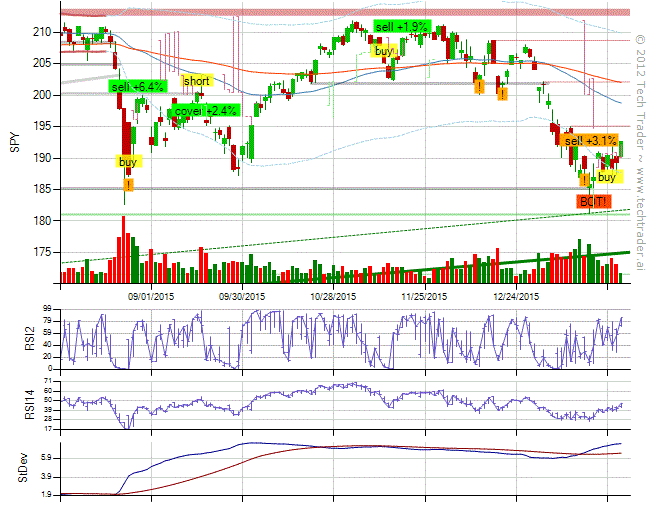
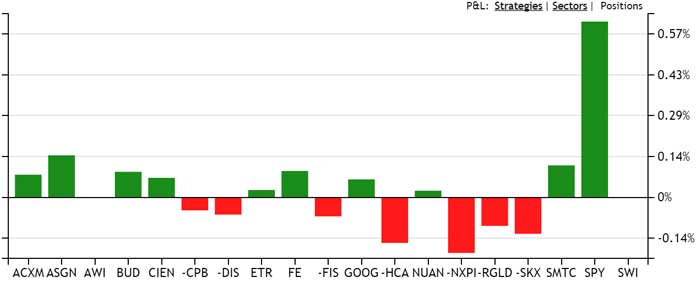
Tech Trader's once-in-a-blue-moon RSI2 SPY signal finally playing out today after an its entry at $186.5 last week. SPY is currently at $192.40 now, a solid 3% up. Just as we expected due to it being monthly capitulation (denoted by the red bottom label), it took longer than the usual few days for us to finally make a solid move up, but we eventually did. Tech Trader is thinking about exiting at the end of today day (denoted by the orange trade in the chart). We shall see if it does.
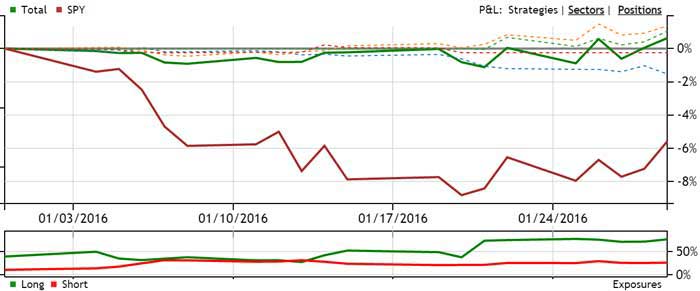
Note that exiting does not mean Tech Trader is bearish, just that it thinks the easy opportunity (buying at extreme lows) is over. Historically, these monthly capitulation bottoms can work months to years, but it's hard to say if it'll be a smooth ride up or not. If it does exit, exposures for Tech Trader overall will drop back to 57% long by 38% short, slightly bullish but with over 40% back in cash. For the month and year, Tech Trader overall is slightly up while S&P500 is still down over 5%; most impressive I think is just the lack of sell off and volatility at all on Tech Trader's side.
Below is Tech Trader's overall trading for January 2016.
Note that exiting does not mean Tech Trader is bearish, just that it thinks the easy opportunity (buying at extreme lows) is over. Historically, these monthly capitulation bottoms can work months to years, but it's hard to say if it'll be a smooth ride up or not. If it does exit, exposures for Tech Trader overall will drop back to 57% long by 38% short, slightly bullish but with over 40% back in cash. For the month and year, Tech Trader overall is slightly up while S&P500 is still down over 5%; most impressive I think is just the lack of sell off and volatility at all on Tech Trader's side.

Below is Tech Trader's overall trading for January 2016.


pftq (Official) says on The Tech Trader Wall...
twgarry (Guest) says on The Tech Trader Wall...
Great signal! Fantastic trade. When I look at IWM on demark I'm leaning
towards this actually being able to put on a good move.
towards this actually being able to put on a good move.
1398 unique view(s)
January 22nd, 2016
pftq (Official) says on The Tech Trader Wall...
SPY already up almost to $190 in premarket from Tech Trader's bottom call at $186.50 yesterday. Never have enough confidence going into these. Thankfully it's automated.
twgarry (Guest) says on The Tech Trader Wall...
fantastic! I love it. great signal.
1354 unique view(s)
January 21st, 2016
pftq (Official) says on The Tech Trader Wall...
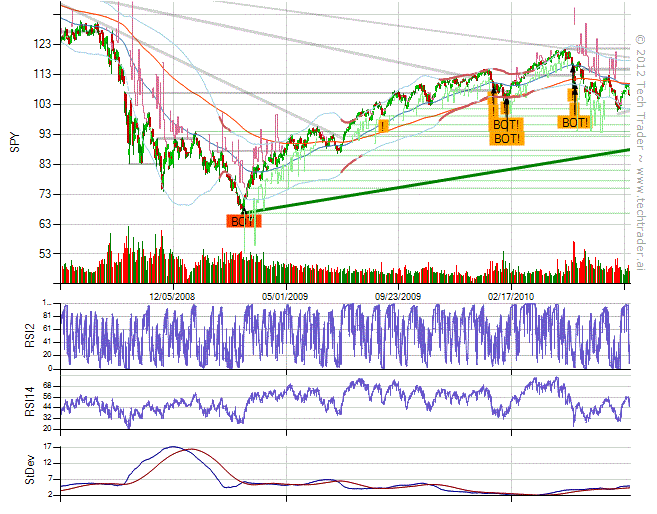
Tech Trader finally calling a bottom to SPY at about $186.50 after a couple weeks of selling off. This signal is a bit different from the last few once-in-a-blue-moon signals in that it's longer time horizon and not necessarily as punctual/v-shaped from the orange ones we've seen, at least by design. The last time we had a red one that was longer time frame was March 2009. The way to interpret this is that this might not be the exact bottom, but Tech Trader thinks it's close enough that it's willing to just get in and hold from here.
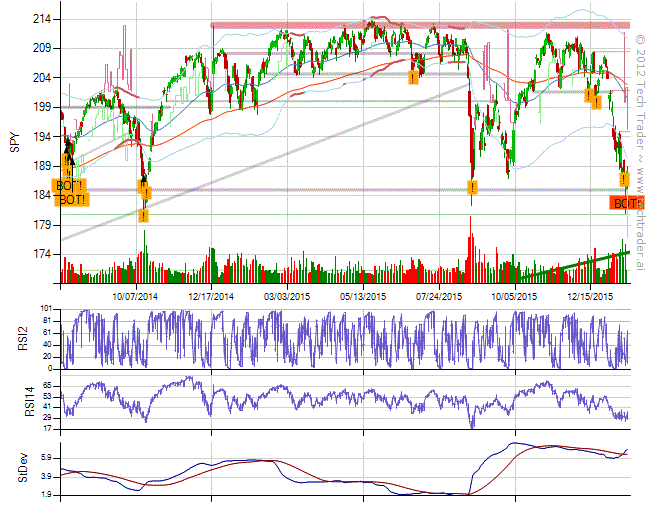
Here is a sample of the signal from 2009.
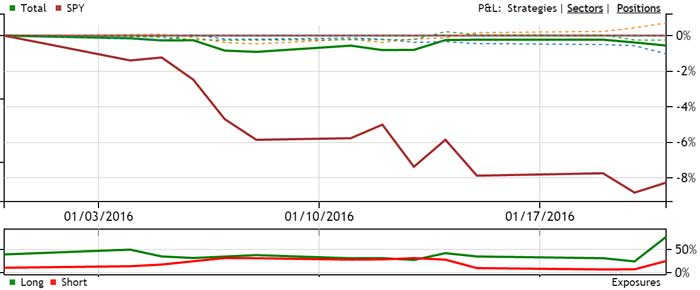
What's also interesting is that Tech Trader has been keeping down exposure both sides this whole way down, so we have no more than 20 positions. Of course, the massive SPY buy now locks us in step a bit with the S&P500 but only after about 8% outperformance for the year.

Here is a sample of the signal from 2009.

What's also interesting is that Tech Trader has been keeping down exposure both sides this whole way down, so we have no more than 20 positions. Of course, the massive SPY buy now locks us in step a bit with the S&P500 but only after about 8% outperformance for the year.

twgarry (Guest) says on The Tech Trader Wall...
i like it!
1285 unique view(s)
January 19th, 2016
pftq (Official) says on The Tech Trader Wall...
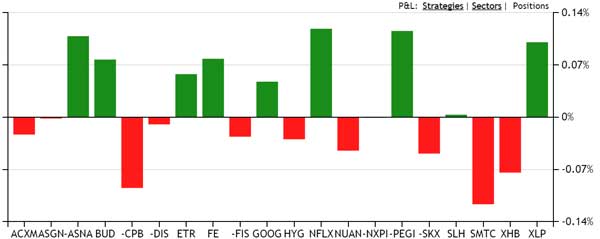
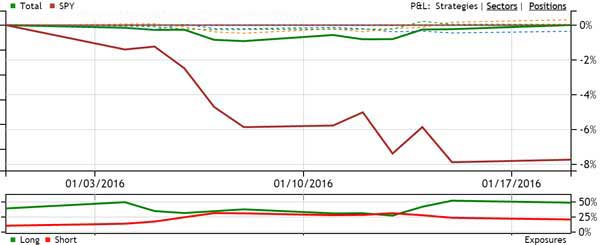
Tech Trader now officially up slightly for the month while S&P500 is down about 8%. Somewhat net long now but still 50% in cash. Netflix (NFLX) also just jumped 10% after hours on earnings, so that will be a nice boost for tomorrow.


1302 unique view(s)
January 15th, 2016
pftq (Official) says on The Tech Trader Wall...
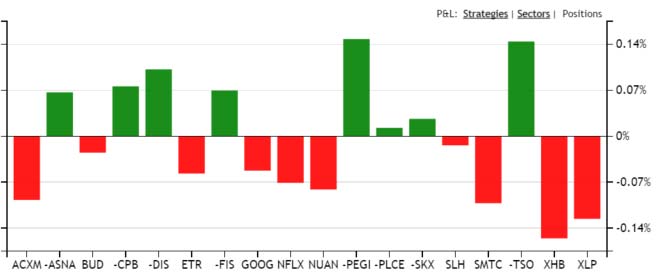
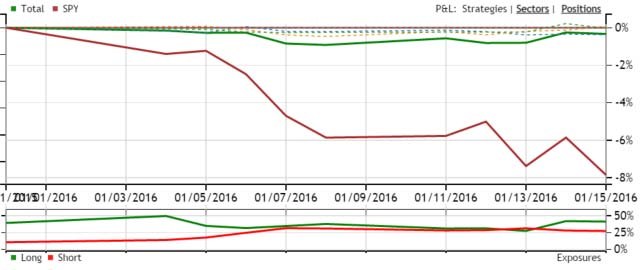
Tech Trader completely flat today with the market down over 2% after capturing the bounce yesterday. We're basically seeing Tech Trader sidestep down days while capturing the upside on up days.


pftq (Official) says on The Tech Trader Wall...
SPY back below $190 and down 1.5% premarket. Tech Trader dodged the sell off yet again by making that day trade.
1279 unique view(s)
January 14th, 2016
pftq (Official) says on The Tech Trader Wall...
Tech Trader starting to finally buy ETFs on intraday bottom signals with SPY at $188; these are like the first responders, could be early but starting to build a long position. SPY, QQQ, and XLP ETFs bought so far. I'm hoping the market actually goes lower for a bit so we can still get our much bigger RSI2 SPY signal that would really confirm a bottom.
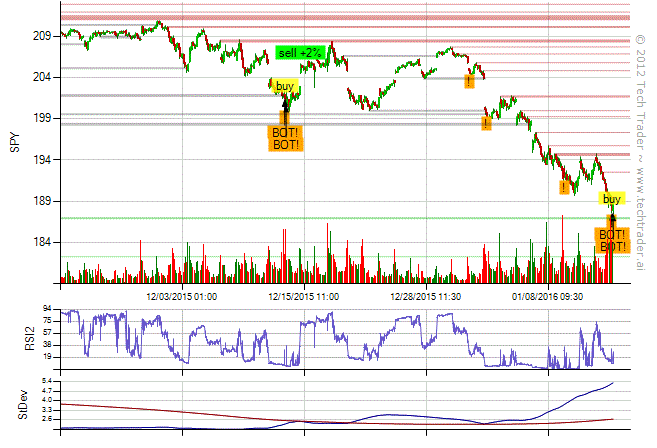
Best part about this bounce is that both long and short positions are still working. SPY and other ETFs off of the marketing timing signals are killing it as usual while shorts like ASNA, SKX, PLCE are also making just as much.
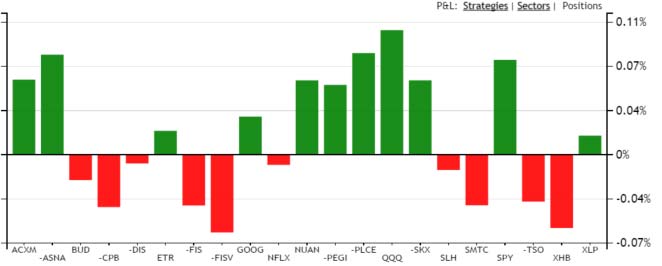
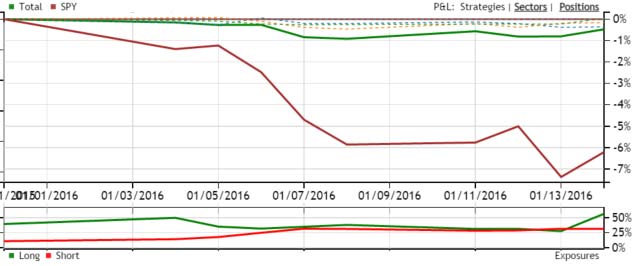

Best part about this bounce is that both long and short positions are still working. SPY and other ETFs off of the marketing timing signals are killing it as usual while shorts like ASNA, SKX, PLCE are also making just as much.


pftq (Official) says on The Tech Trader Wall...


